Data · updated monthly
Average Electricity Prices by State
What households pay per kilowatt-hour in all 50 states and D.C.: August 2026 compared with August 2025, straight from the U.S. Energy Information Administration (EIA).
- Data month
- August 2026 (preliminary)
- EIA release
- October 23, 2026
- Page updated
- Next EIA release
- November 24, 2026
Prices rose in 44 of 51 states (incl. D.C.) compared with August 2025. Jump to the table · Download CSV
Map
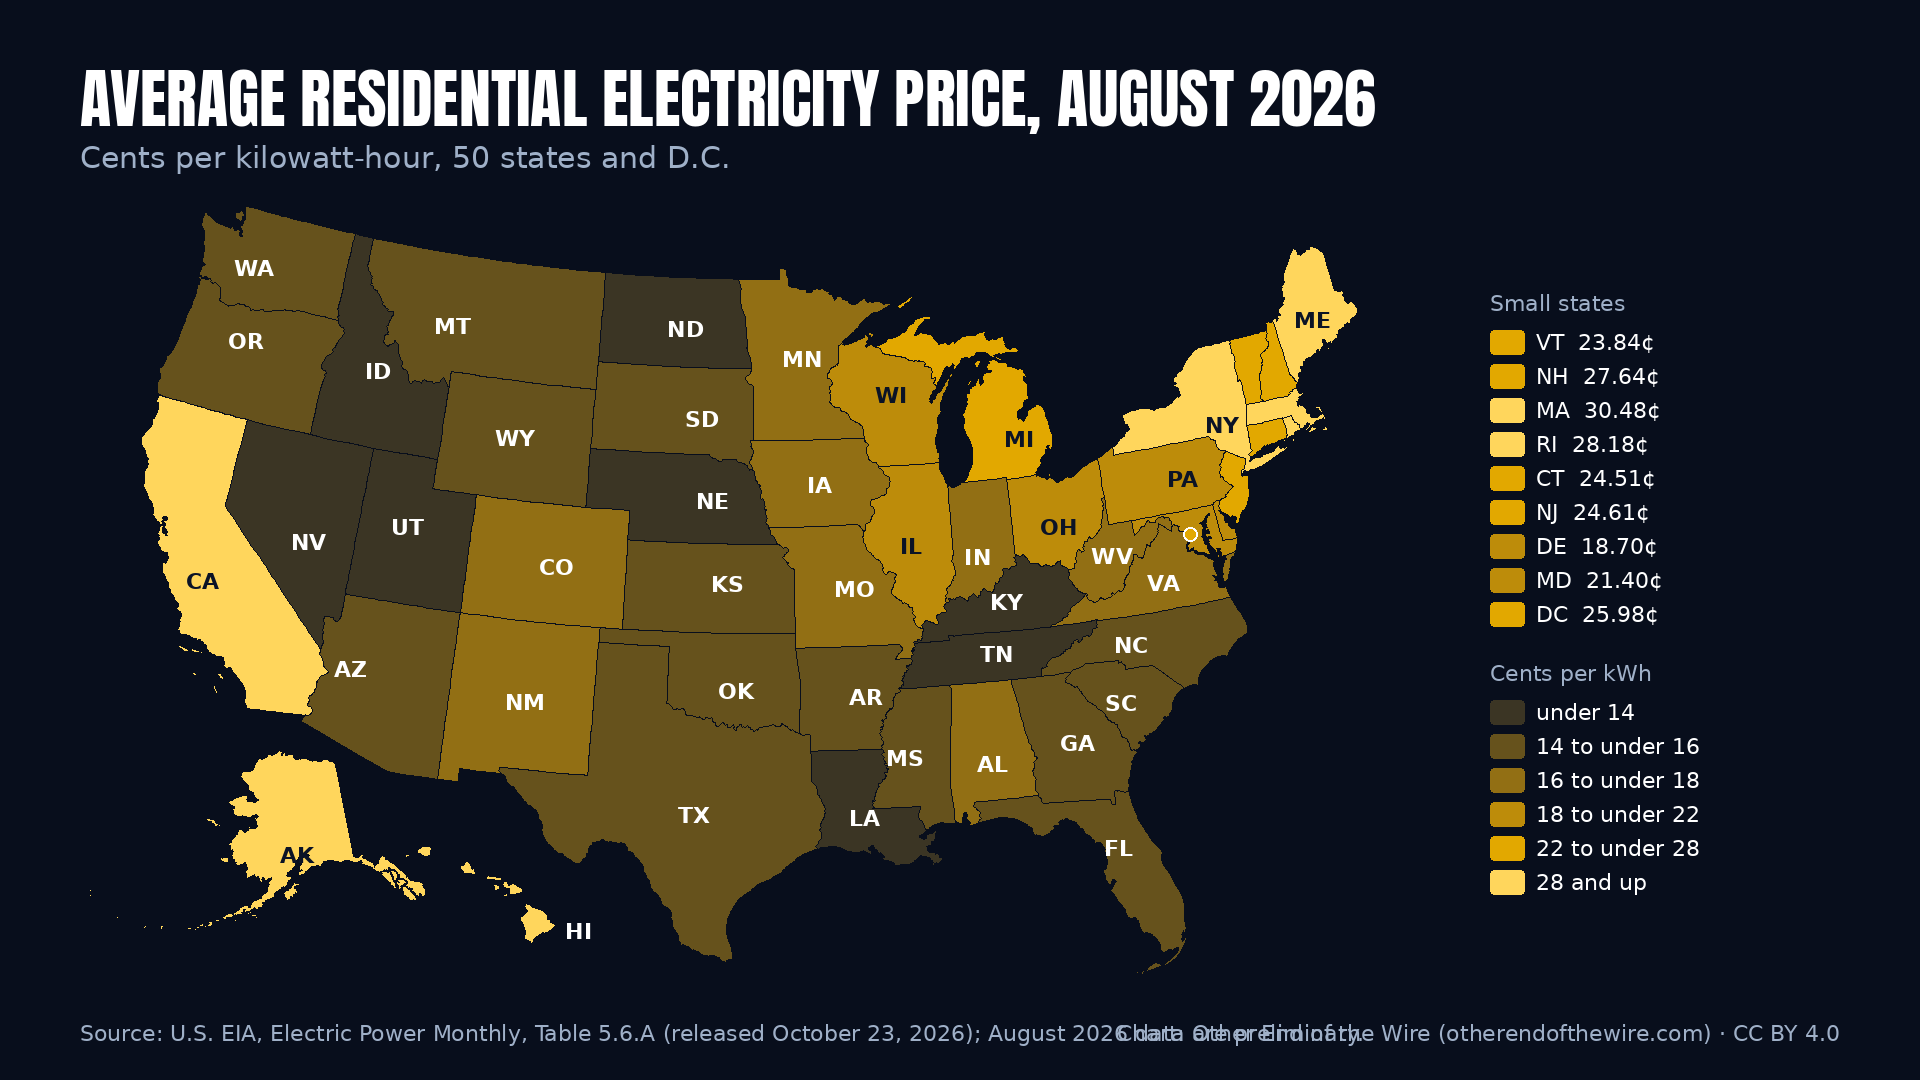
Map: average residential electricity price by state, August 2026
Choropleth map of the United States in six price bands. Highest: Hawaii at 47.18¢ per kWh; lowest: Nevada at 12.72¢. Every value is in the table below.
- under 14¢
- 14¢ to under 16¢
- 16¢ to under 18¢
- 18¢ to under 22¢
- 22¢ to under 28¢
- 28¢ and up
Source: U.S. EIA, Electric Power Monthly, Table 5.6.A (released October 23, 2026); August 2026 data are preliminary. Map: U.S. Census Bureau boundaries (public domain). Chart: Other End of the Wire, CC BY 4.0. PNG (1920×1080)CSV: all values
All states
Select a column header to sort. Without JavaScript the table is sorted by price, most expensive first.
| State | Price August 2026 |
Price August 2025 |
Change | Rank | Avg. bill August 2026 | Avg. use kWh, August 2026 |
|---|---|---|---|---|---|---|
| Hawaii | 47.18¢ | 38.53¢ | +22.5% | 1 | $269 | 570 |
| Maine | 32.11¢ | 28.14¢ | +14.1% | 2 | $157 | 489 |
| Massachusetts | 30.48¢ | 30.55¢ | −0.2% | 3 | $236 | 774 |
| California | 29.75¢ | 30.92¢ | −3.8% | 4 | $235 | 789 |
| Alaska | 29.41¢ | 27.79¢ | +5.8% | 5 | $139 | 473 |
| New York | 28.65¢ | 26.64¢ | +7.5% | 6 | $212 | 742 |
| Rhode Island | 28.18¢ | 26.53¢ | +6.2% | 7 | $176 | 625 |
| New Hampshire | 27.64¢ | 24.44¢ | +13.1% | 8 | $202 | 730 |
| District of Columbia | 25.98¢ | 23.18¢ | +12.1% | 9 | $206 | 791 |
| New Jersey | 24.61¢ | 24.70¢ | −0.4% | 10 | $236 | 960 |
| Connecticut | 24.51¢ | 30.17¢ | −18.8% | 11 | $204 | 834 |
| Vermont | 23.84¢ | 22.10¢ | +7.9% | 12 | $142 | 596 |
| Michigan | 22.99¢ | 20.73¢ | +10.9% | 13 | $172 | 750 |
| Pennsylvania | 21.77¢ | 19.93¢ | +9.2% | 14 | $198 | 911 |
| Maryland | 21.40¢ | 19.89¢ | +7.6% | 15 | $233 | 1,091 |
| Wisconsin | 19.41¢ | 18.44¢ | +5.3% | 16 | $148 | 761 |
| Ohio | 19.38¢ | 17.55¢ | +10.4% | 17 | $199 | 1,029 |
| Illinois | 19.32¢ | 18.03¢ | +7.2% | 18 | $171 | 886 |
| Delaware | 18.70¢ | 16.85¢ | +11.0% | 19 | $210 | 1,121 |
| Virginia | 17.64¢ | 15.85¢ | +11.3% | 20 | $220 | 1,246 |
| Minnesota | 17.20¢ | 16.89¢ | +1.8% | 21 | $145 | 844 |
| Colorado | 17.17¢ | 16.21¢ | +5.9% | 22 | $167 | 973 |
| Iowa | 17.06¢ | 15.48¢ | +10.2% | 23 | $149 | 872 |
| Indiana | 17.02¢ | 16.21¢ | +5.0% | 24 | $189 | 1,110 |
| New Mexico | 16.51¢ | 15.98¢ | +3.3% | 25 | $162 | 983 |
| Alabama | 16.33¢ | 16.26¢ | +0.4% | 26 | $254 | 1,555 |
| West Virginia | 16.31¢ | 15.62¢ | +4.4% | 27 | $174 | 1,069 |
| Missouri | 16.02¢ | 15.32¢ | +4.6% | 28 | $216 | 1,347 |
| Oregon | 15.92¢ | 15.85¢ | +0.4% | 29 | $135 | 847 |
| Texas | 15.91¢ | 15.40¢ | +3.3% | 30 | $266 | 1,670 |
| Georgia | 15.90¢ | 15.55¢ | +2.3% | 31 | $234 | 1,471 |
| South Carolina | 15.76¢ | 15.16¢ | +4.0% | 32 | $226 | 1,436 |
| Montana | 15.57¢ | 14.29¢ | +9.0% | 33 | $122 | 784 |
| Kansas | 15.47¢ | 14.65¢ | +5.6% | 34 | $204 | 1,316 |
| South Dakota | 15.15¢ | 13.90¢ | +9.0% | 35 | $160 | 1,057 |
| Arizona | 15.05¢ | 15.09¢ | −0.3% | 36 | $269 | 1,789 |
| Florida | 14.99¢ | 15.33¢ | −2.2% | 37 | $217 | 1,449 |
| North Carolina | 14.95¢ | 14.59¢ | +2.5% | 38 | $196 | 1,310 |
| Oklahoma | 14.82¢ | 14.42¢ | +2.8% | 39 | $251 | 1,696 |
| Washington | 14.63¢ | 13.65¢ | +7.2% | 40 | $120 | 819 |
| Mississippi | 14.43¢ | 13.61¢ | +6.0% | 41 | $239 | 1,655 |
| Wyoming | 14.43¢ | 14.33¢ | +0.7% | 41 | $119 | 821 |
| Arkansas | 14.37¢ | 13.33¢ | +7.8% | 43 | $217 | 1,510 |
| Kentucky | 13.80¢ | 13.10¢ | +5.3% | 44 | $188 | 1,364 |
| Nebraska | 13.54¢ | 12.80¢ | +5.8% | 45 | $155 | 1,144 |
| Tennessee | 13.42¢ | 13.09¢ | +2.5% | 46 | $206 | 1,532 |
| Idaho | 13.37¢ | 12.08¢ | +10.7% | 47 | $137 | 1,026 |
| North Dakota | 13.31¢ | 12.97¢ | +2.6% | 48 | $130 | 979 |
| Utah | 13.31¢ | 13.62¢ | −2.3% | 48 | $164 | 1,230 |
| Louisiana | 12.87¢ | 12.55¢ | +2.5% | 50 | $227 | 1,763 |
| Nevada | 12.72¢ | 12.54¢ | +1.4% | 51 | $207 | 1,631 |
| U.S. average | 18.16¢ | 17.57¢ | +3.4% | – | $209 | 1,152 |
Why prices differ by state
A kilowatt-hour costs more in some states than in others for a few practical reasons.
Fuel and power plants. States with plenty of low-cost generation nearby, such as large hydropower dams or local natural gas, tend to pay less. Island states that ship in fuel, like Hawaii, pay the most.
Delivery. Poles, wires and substations are a large part of every bill. They cost more per customer where homes are spread out, where storms or wildfires require extra work, or where much of the grid is being rebuilt.
Usage. The price here is revenue divided by kilowatt-hours. Where homes use a lot of electricity, fixed costs are spread over more kilowatt-hours, so the average price can be low even when bills are high.
Seasons. Many utilities charge different rates in summer and winter, so a single month can rank states differently than a full year.
Download the data
- electricity-prices-by-state-latest.csv – always the latest month (stable link)
- electricity-prices-by-state-2026-08.csv – this month, fixed
- electricity-prices-by-state-map-2026-08.png – map as PNG
Columns: price this month and a year earlier (¢/kWh), change in percent, rank (1 = most expensive), average monthly bill and use per residential customer, and the year-to-date price (January–August) for both years.
Earlier months
Source and method
- Price: U.S. Energy Information Administration (EIA), Electric Power Monthly, Table 5.6.A – Table 5.6.A. Average Price of Electricity to Ultimate Customers by End-Use Sector, by State, August 2026 and 2025 (Cents per Kilowatthour). Residential column. Released October 23, 2026.
- Year to date: EIA, Electric Power Monthly, Table 5.6.B (in the CSV).
- Bill and use: EIA Form EIA-861M via the EIA API (electricity/retail-sales). Average monthly bill = residential revenue ÷ residential customers; average use = residential sales ÷ customers, same month. Our calculation.
- What the price means: EIA’s average price is total residential revenue divided by kilowatt-hours sold. It includes energy, delivery and fixed monthly charges spread over all kWh, so it is an average, not the rate on any single tariff.
- Preliminary: August 2026 values are EIA estimates from a monthly sample and can be revised; August 2025 values are final. Change and rank are calculated from the two-decimal values shown. Equal prices share a rank.
- Check: every monthly update compares each state’s price in Table 5.6.A with the same value from the EIA API before publishing.
- Map: U.S. Census Bureau cartographic boundary file (2023, 1:20 million), public domain. Fixed price bands so maps from different months can be compared.
How to cite
Please cite the EIA as the source of the data, and us if you use our map, table or CSV:
U.S. Energy Information Administration, Electric Power Monthly, Table 5.6.A, “Average Price of Electricity to Ultimate Customers by End-Use Sector, by State,” August 2026 (released October 23, 2026). Compiled by Other End of the Wire, https://otherendofthewire.com/data/electricity-prices-by-state/ (accessed [date]).
Short form for charts and social posts: “Data: U.S. EIA, Electric Power Monthly, Table 5.6.A (August 2026). Chart: Other End of the Wire.”
License. Our map, table layout and CSV compilation are licensed under Creative Commons Attribution 4.0 (CC BY 4.0): you may share and adapt them, also commercially, if you credit “Other End of the Wire” and link to this page. The underlying EIA data are U.S. government works in the public domain; EIA asks to be cited as the source.
Related videos
Spotted an error? Tell us – fixes are logged on the corrections page.
Education only, not financial advice.
The creator has no financial interest in any U.S. utility or data-center company.