Video · November 13, 2026
Are Data Centers Really Raising Your Power Bill?
We checked EIA price data for all 50 states and D.C. Nationally through 2025: mostly no. In the PJM grid region since mid-2025: measurably yes. Here’s why, and what the new rules mean for you.
Loads from YouTube (youtube-nocookie.com) only after you click play; YouTube’s privacy policy applies from then on.
Out November 13, 2026, 1 p.m. ET (19:00 CET). Until then the player may show the video as scheduled.
Watch on YouTube · Narration is AI-generated; script researched and reviewed by a human.
What the video covers
Data centers are blamed for rising power bills; others call that a myth. We checked U.S. Energy Information Administration price data for all 50 states and D.C.
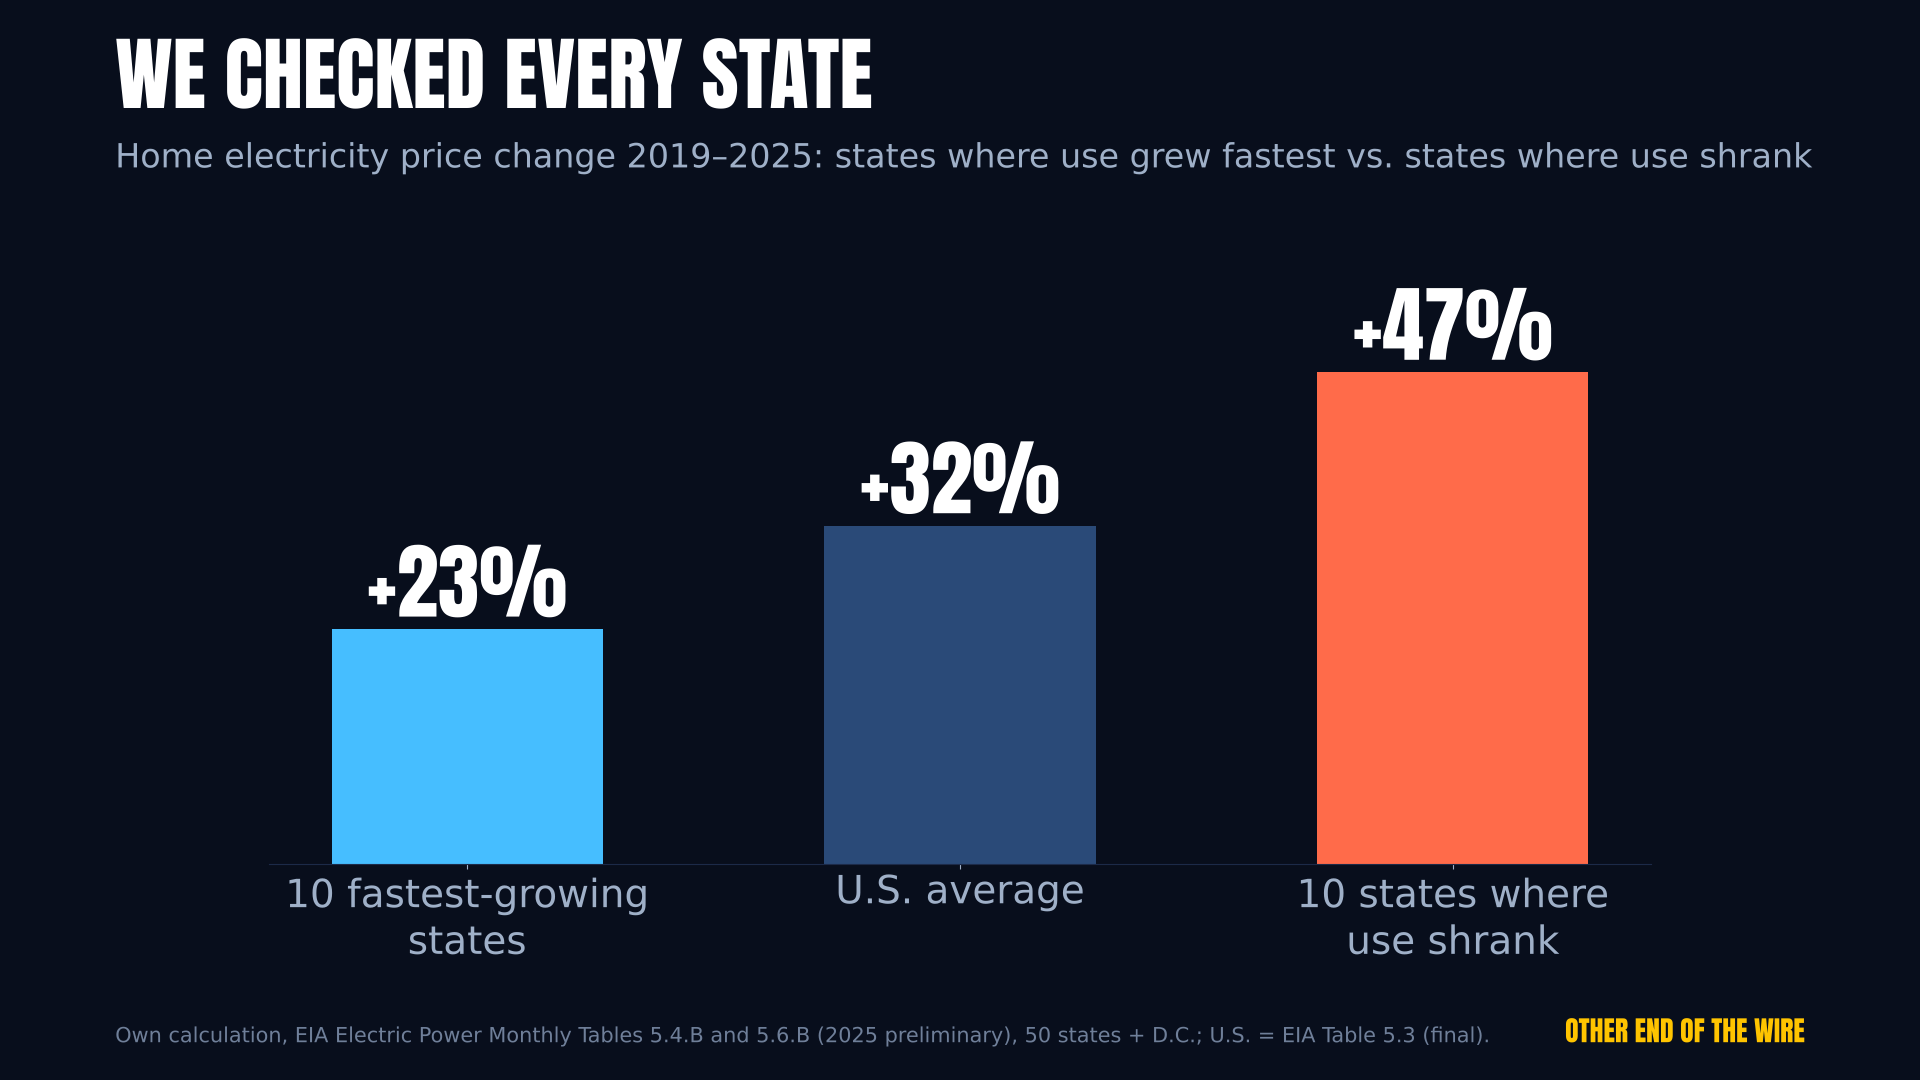
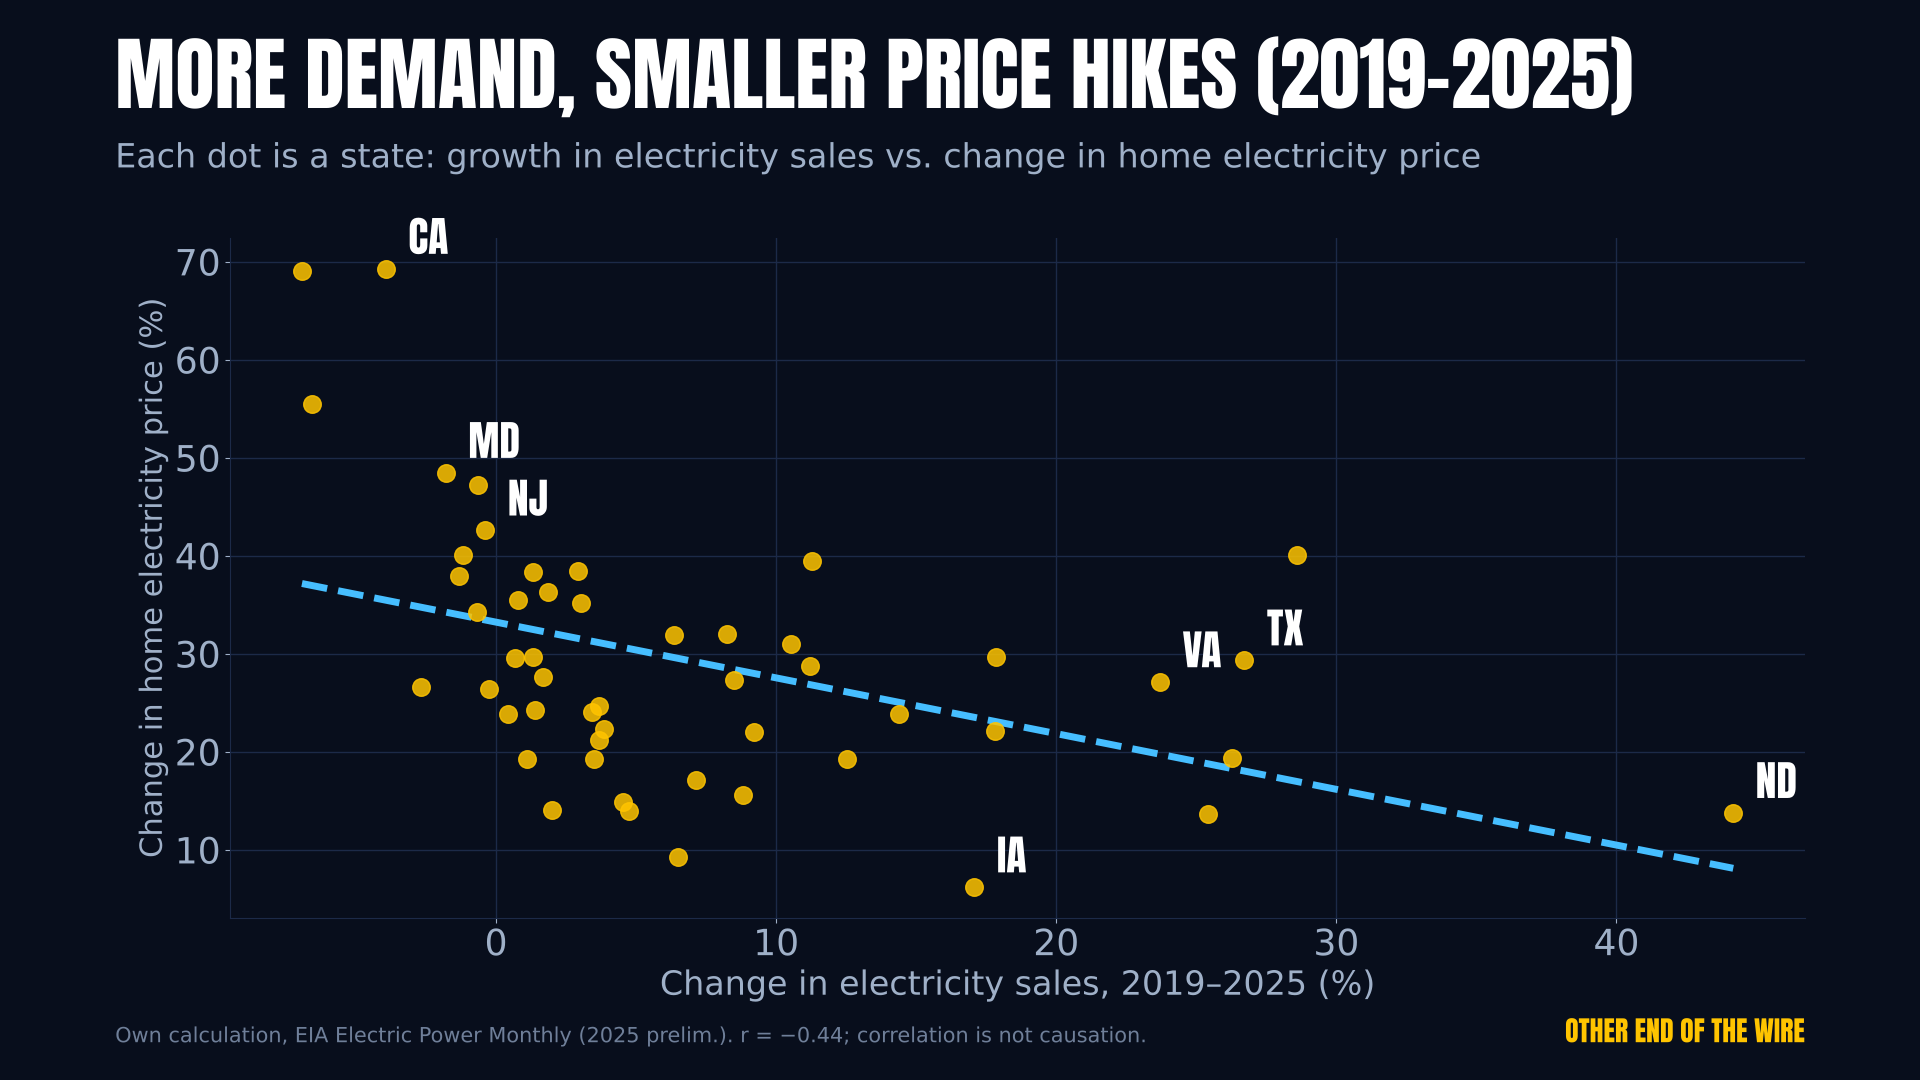
Nationally, through 2025, the answer is mostly no: the ten states where electricity use grew fastest since 2019 saw smaller home-price increases (+23%) than the ten states where use shrank (+47%). Data centers used about 4.7% of U.S. electricity in 2024, according to Berkeley Lab.
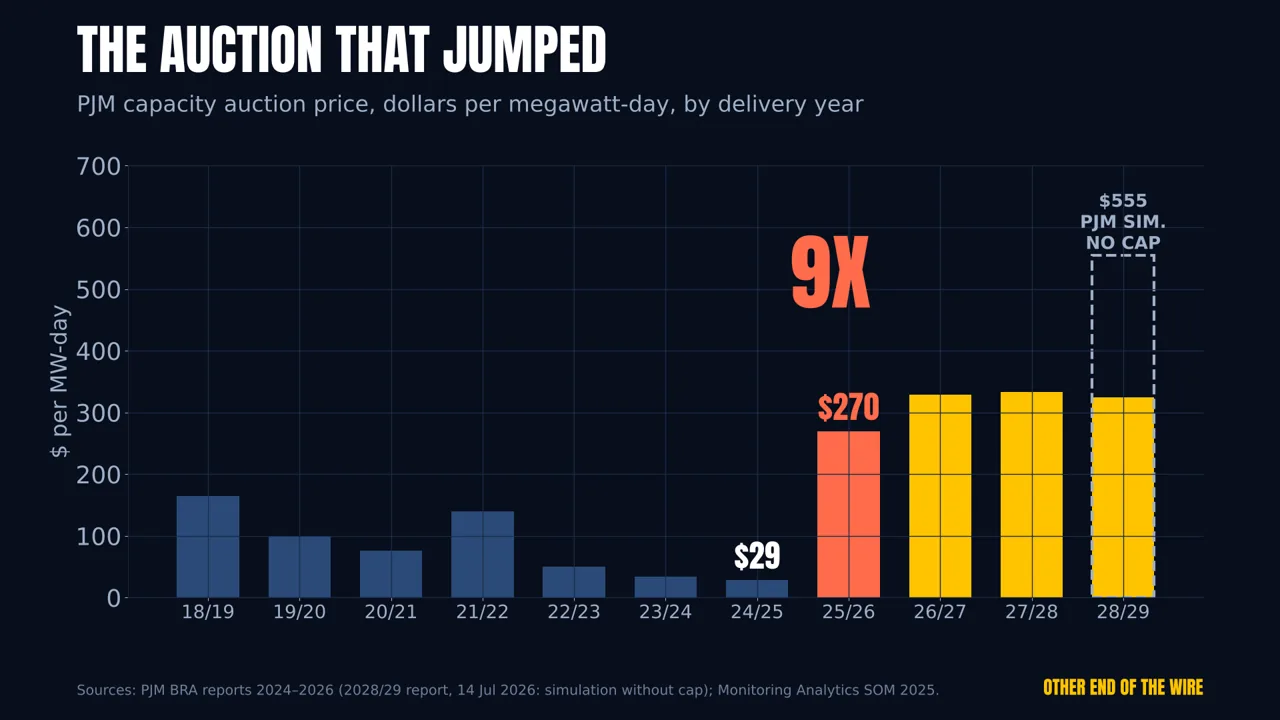
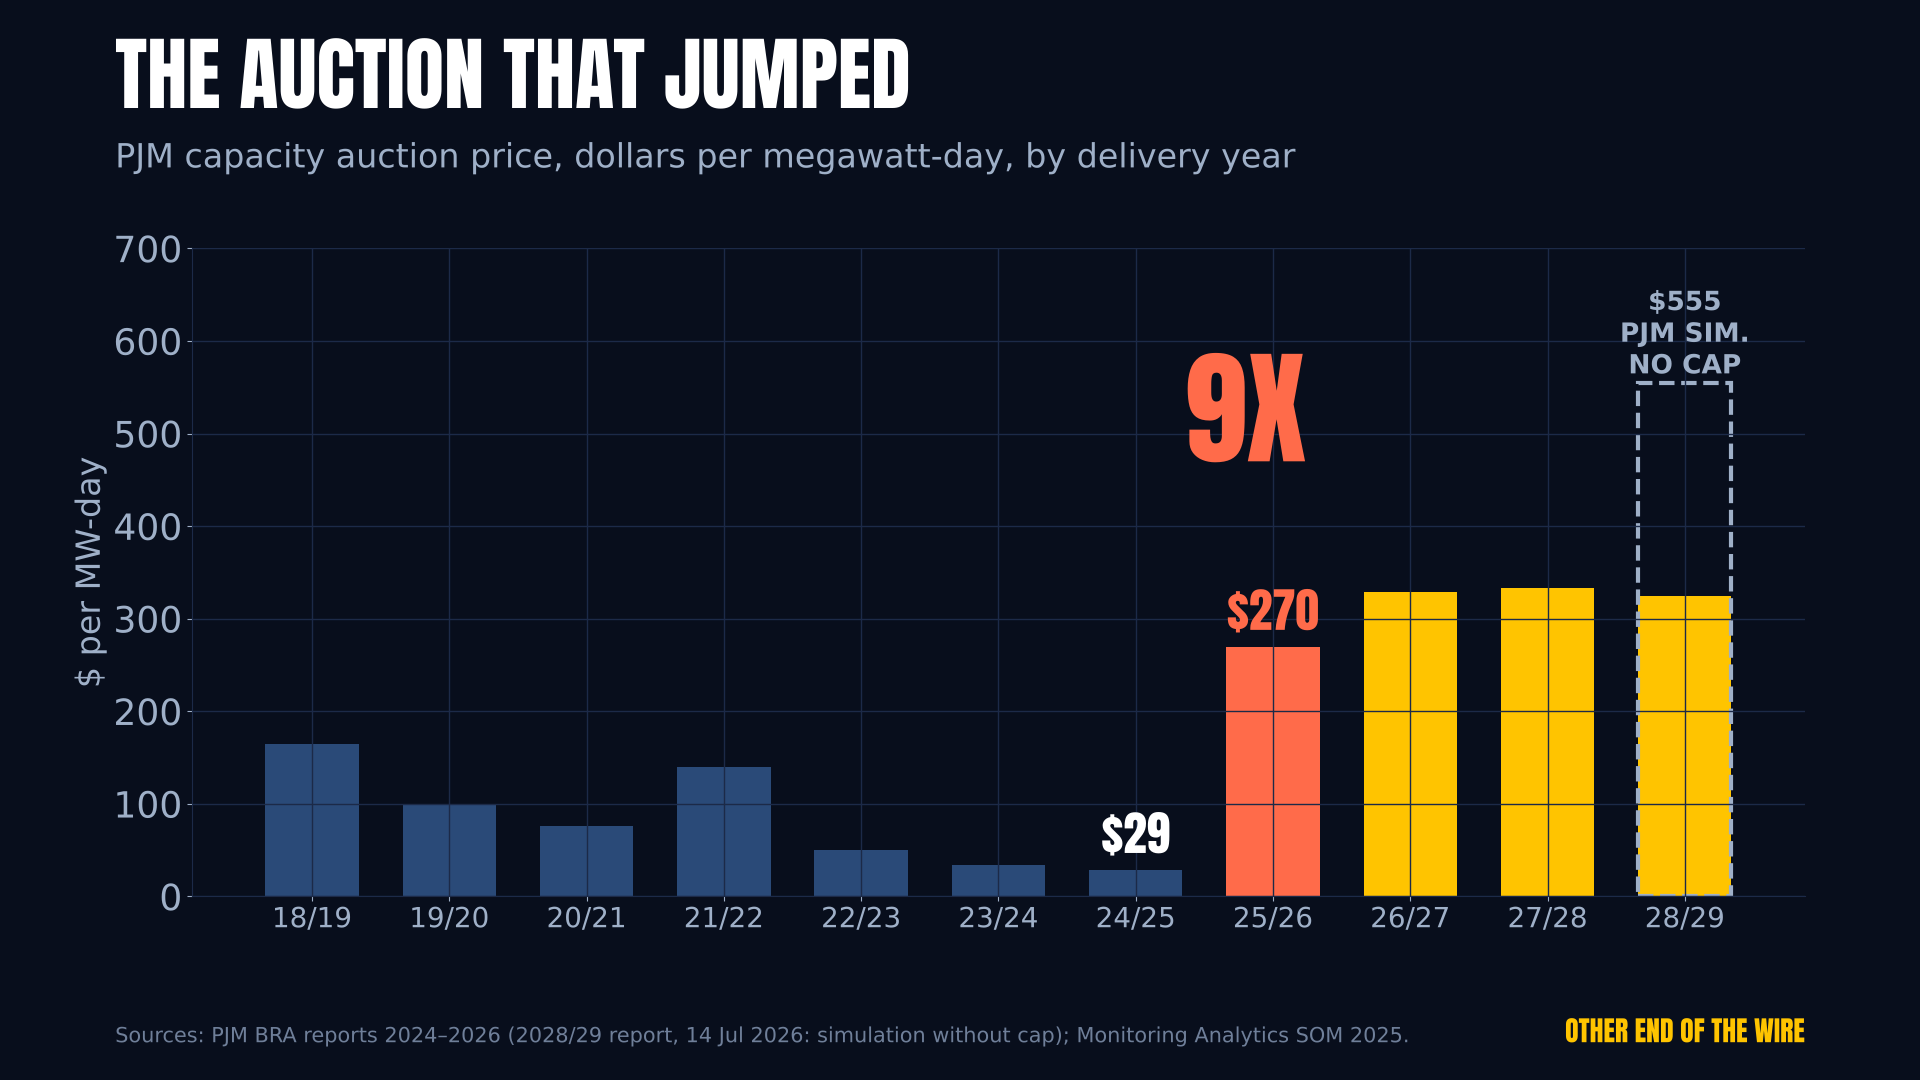
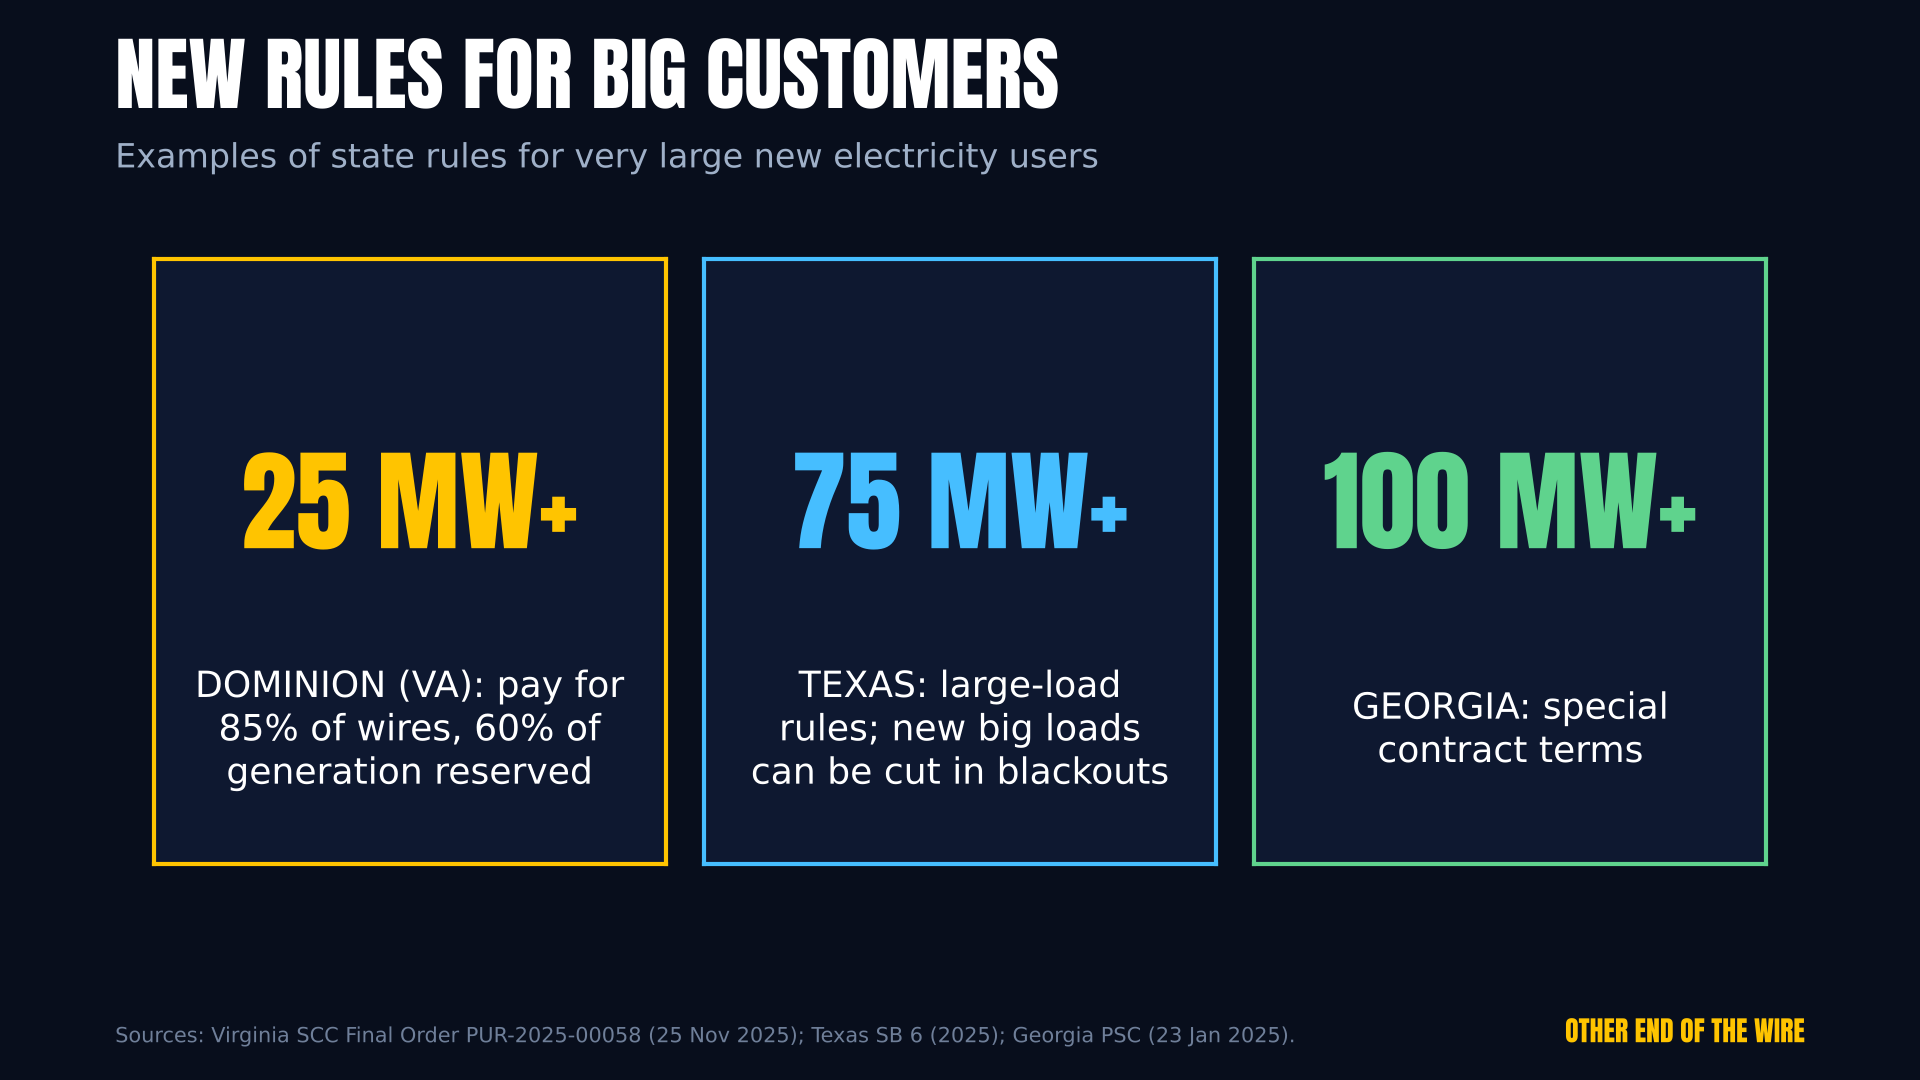
In the PJM grid region (13 states plus D.C.), the picture changed: the capacity auction price jumped about ninefold, and PJM’s independent market monitor attributes about $29 billion over four auctions to data-center load. Since mid-2025 that shows up in bills. The video ends with the new state rules (Virginia, Texas, Georgia) that decide who pays next.
Related data: Average electricity prices by state – all 50 states and D.C., updated monthly from EIA data
Chapters
- 0:00 Intro
- 0:41 1. How Big Is the Boom?
- 1:34 2. The National Picture
- 3:03 3. The Auction That Jumped
- 4:28 4. When It Hits Your Bill
- 6:16 5. Who Pays Next?
- 7:56 Recap
Our charts
Every chart in this video was built by us from the source data with our own code. No third-party images are shown here. Download the full-size PNG and, where we used raw data, the CSV behind it. A selection of our charts is free to reuse under CC BY 4.0. For other charts, please contact us.
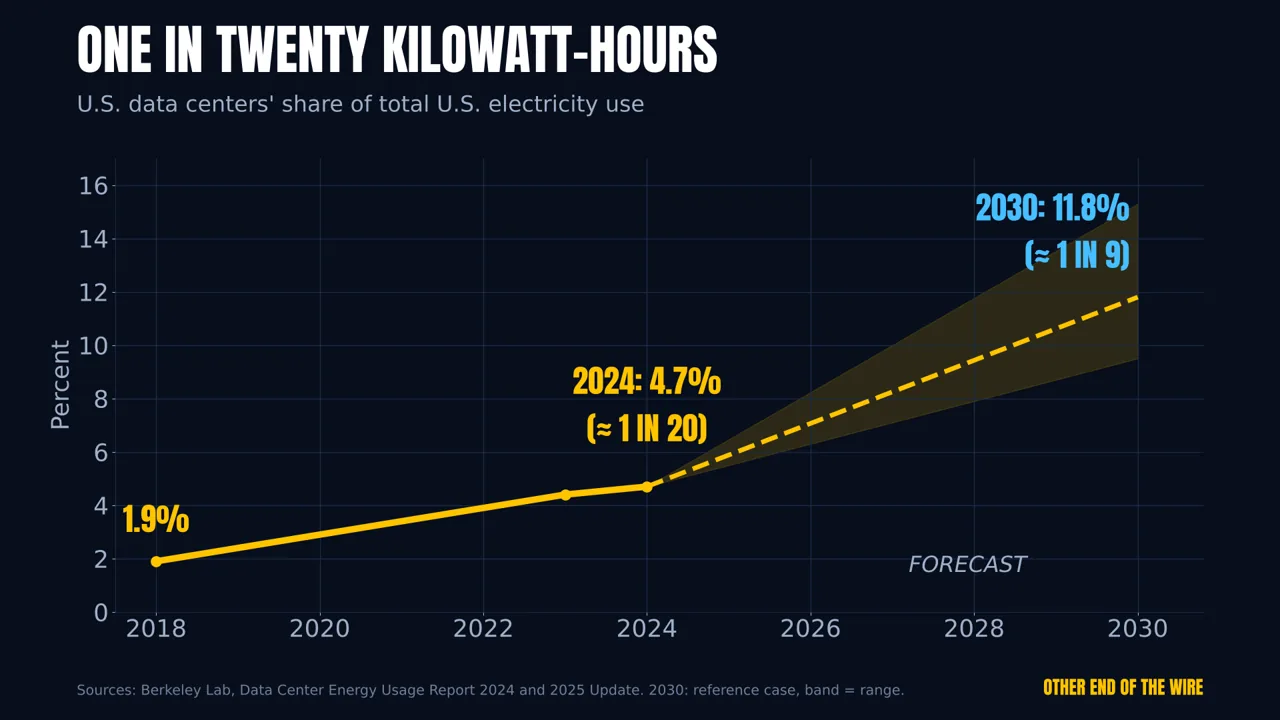
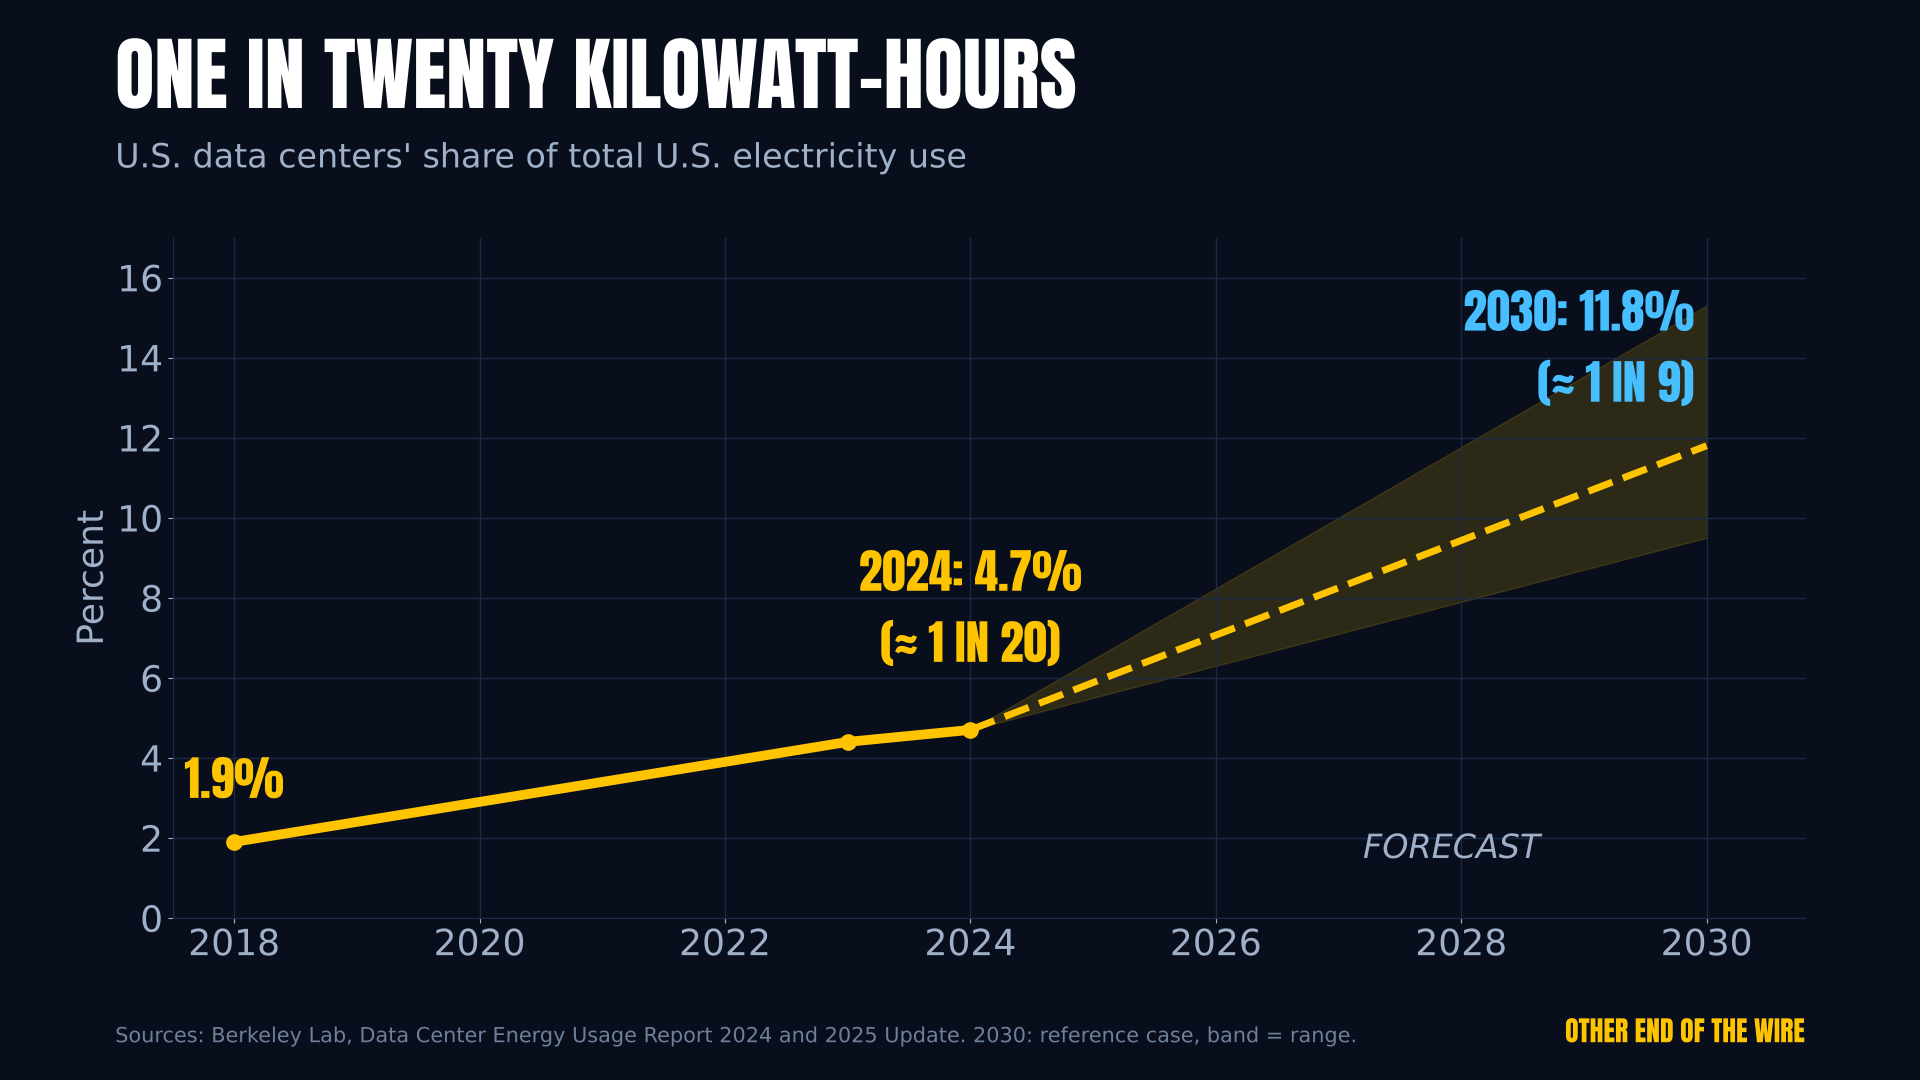
Source: Berkeley Lab, Data Center Energy Usage Report 2024 and 2025 Update. 2030: reference case, band = range.PNG (1920×1080)CSV: us_datacenter_electricity.csv
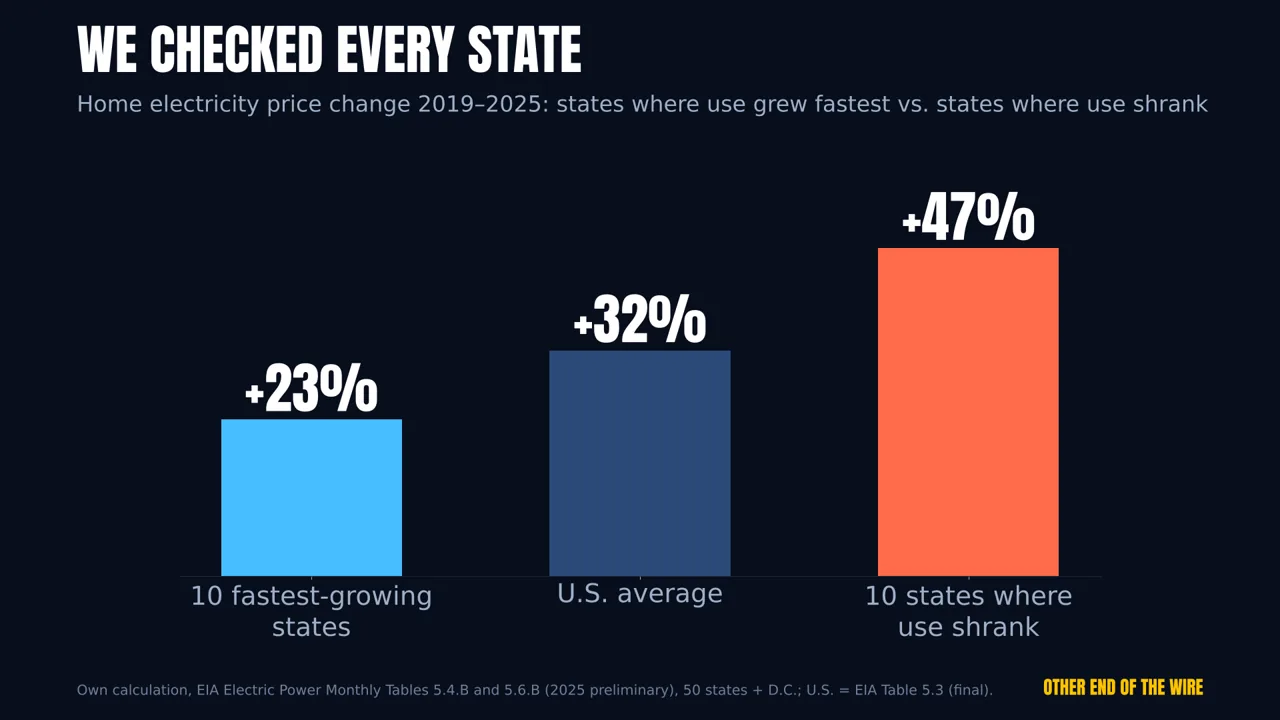
Source: Own calculation, EIA Electric Power Monthly Tables 5.4.B and 5.6.B (2025 preliminary), 50 states + D.C.; U.S. = EIA Table 5.3 (final).PNG (1920×1080)CSV: state_prices_2019_2026.csv
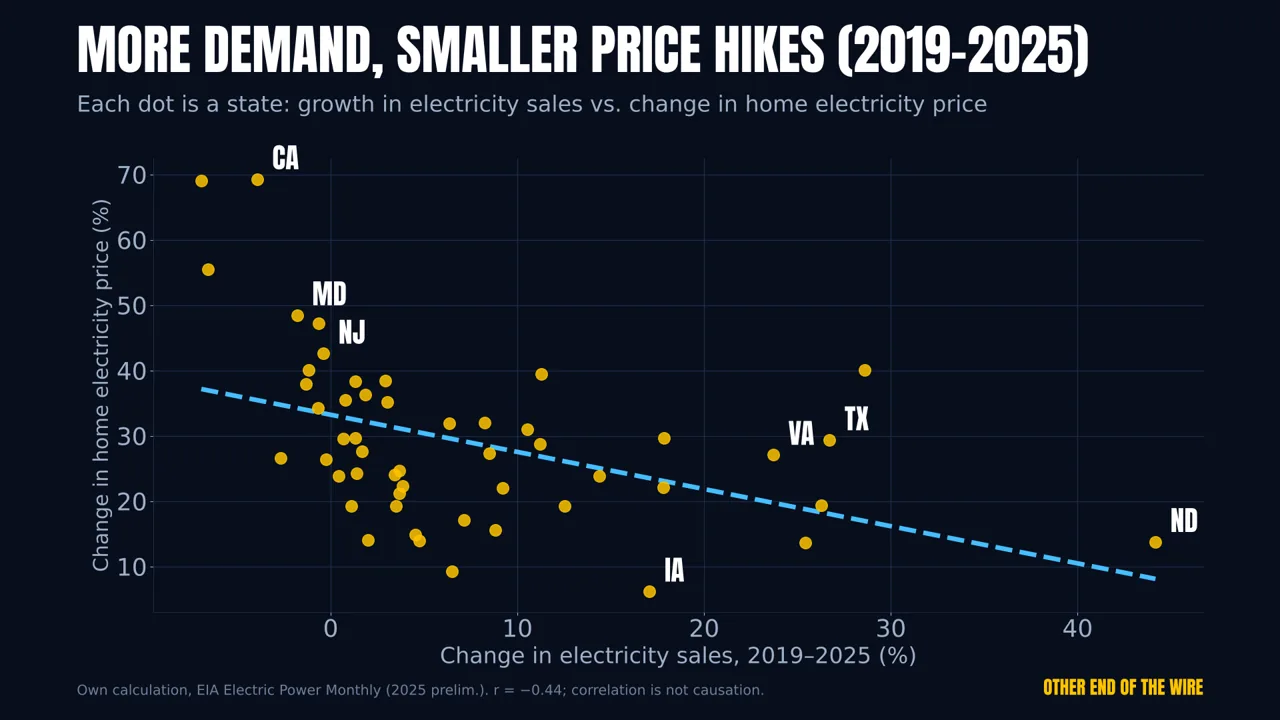
Source: Own calculation, EIA Electric Power Monthly (2025 preliminary).PNG (1920×1080)CSV: state_prices_2019_2026.csv

Source: PJM BRA reports 2024–2026 (2028/29 report, 14 Jul 2026: simulation without cap); Monitoring Analytics, 2025 State of the Market.PNG (1920×1080)CSV: pjm_capacity_auctions.csv
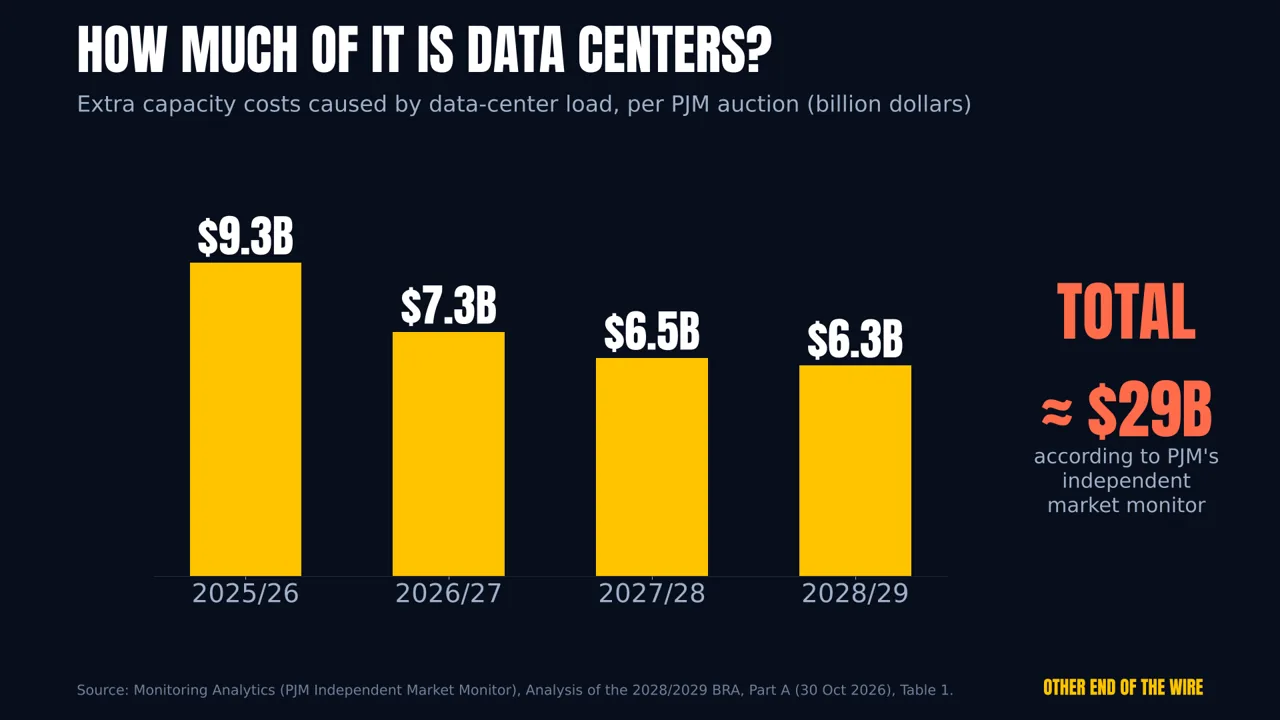
Source: Monitoring Analytics (PJM Independent Market Monitor), Analysis of the 2028/2029 BRA, Part A (30 Oct 2026), Table 1.PNG (1920×1080)CSV: pjm_capacity_auctions.csv
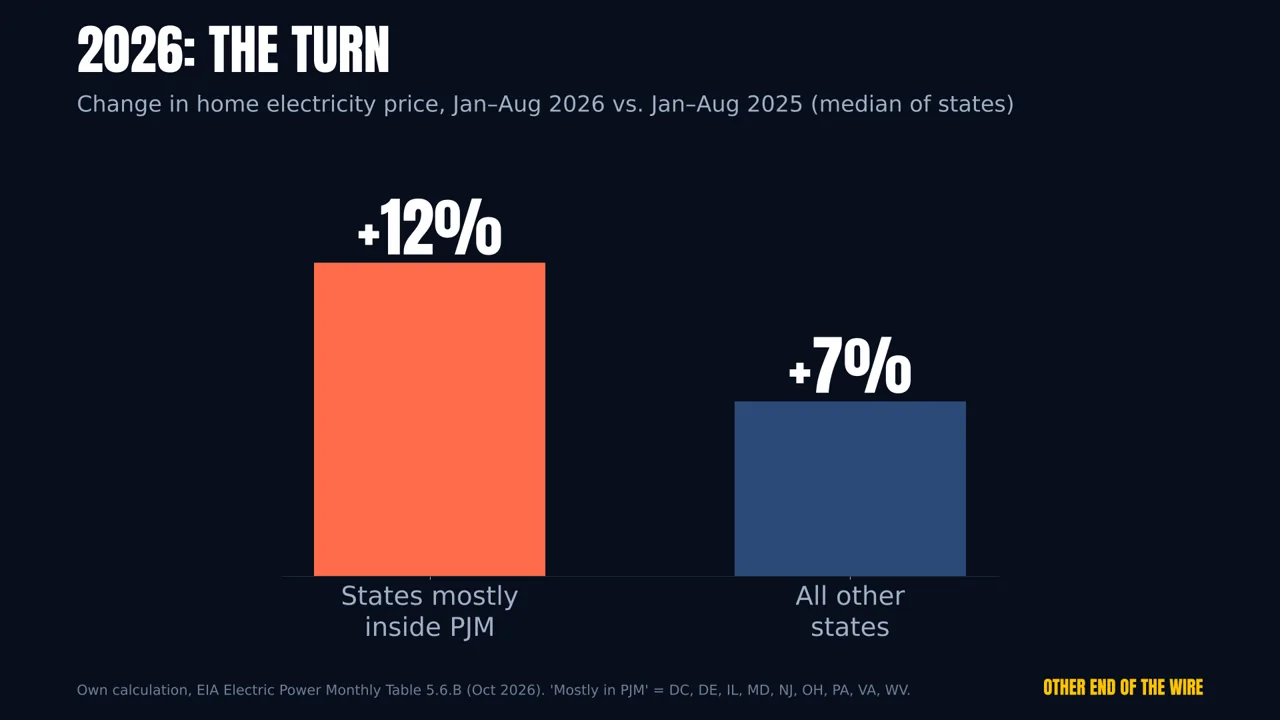
Source: Own calculation, EIA Electric Power Monthly Table 5.6.B (Oct 2026). “Mostly in PJM” = DC, DE, IL, MD, NJ, OH, PA, VA, WV.PNG (1920×1080)CSV: state_prices_2019_2026.csv
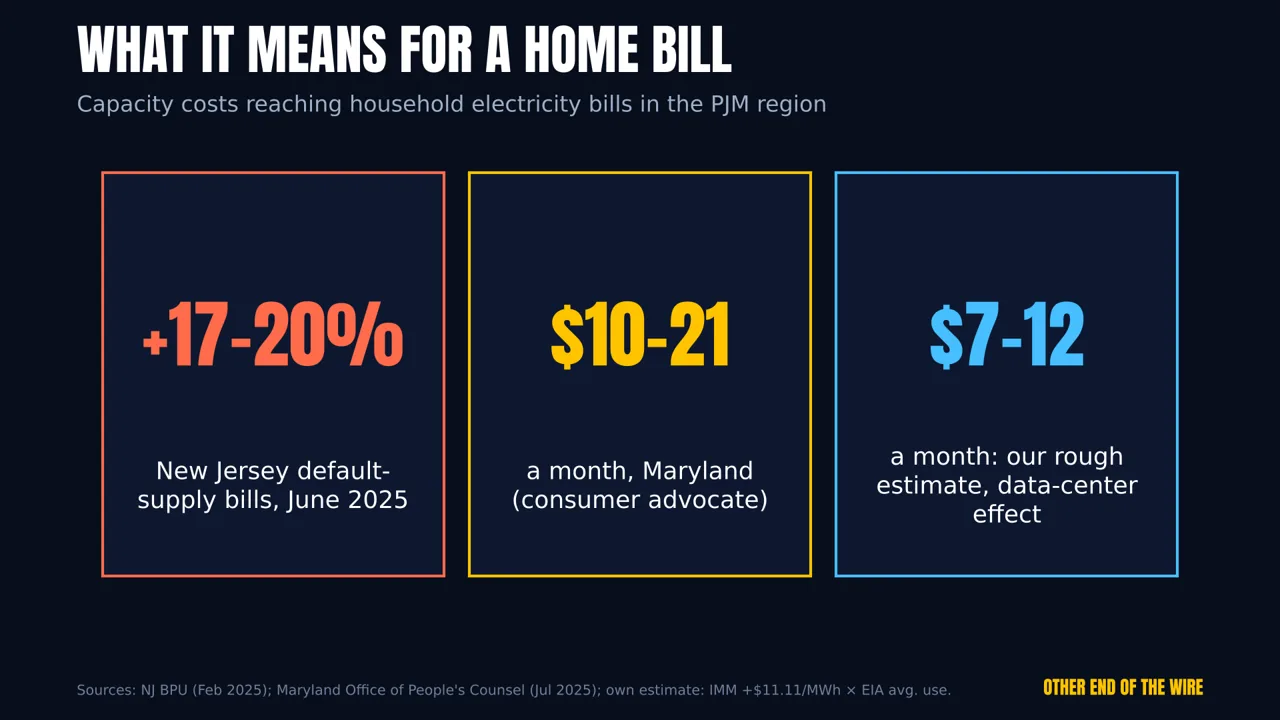
Source: NJ BPU (Feb 2025); Maryland Office of People’s Counsel (Jul 2025); own estimate: IMM +$11.11/MWh × EIA average use.PNG (1920×1080)CSV: household_bill_effects.csv
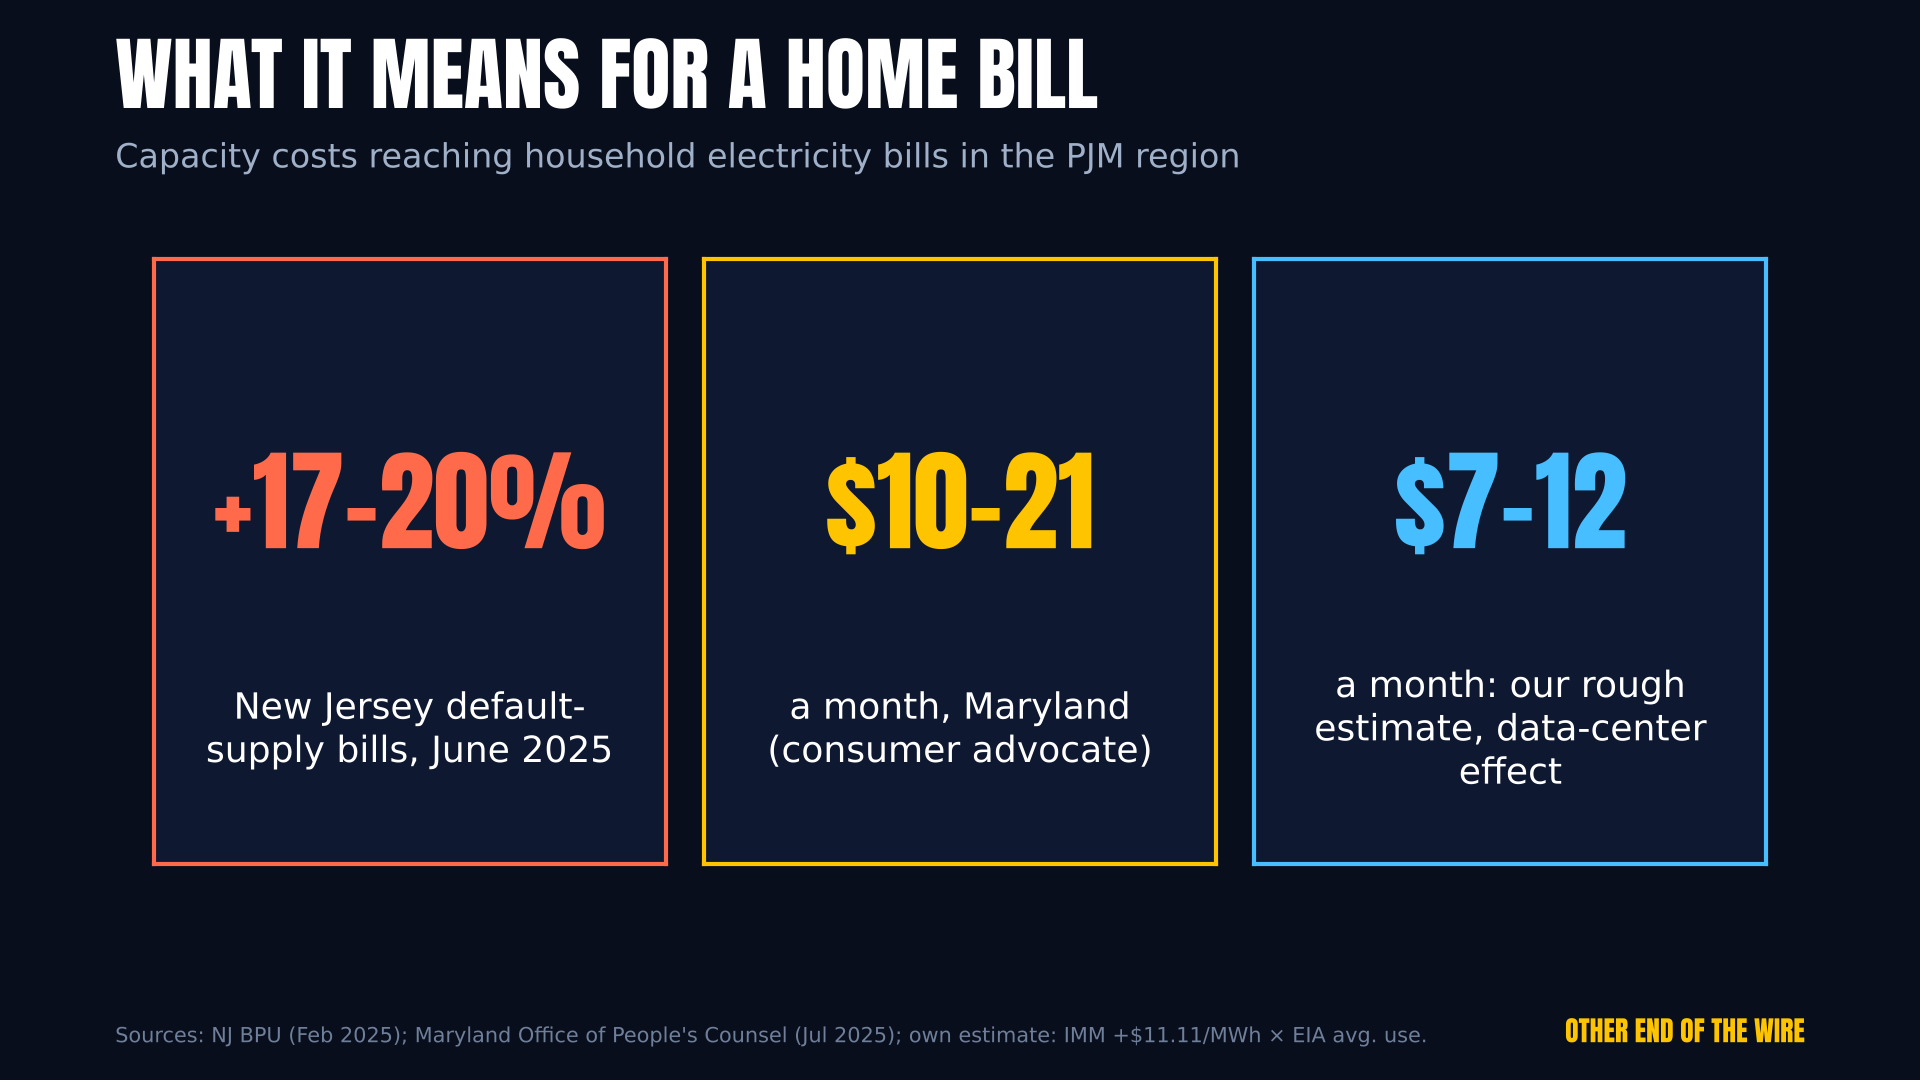
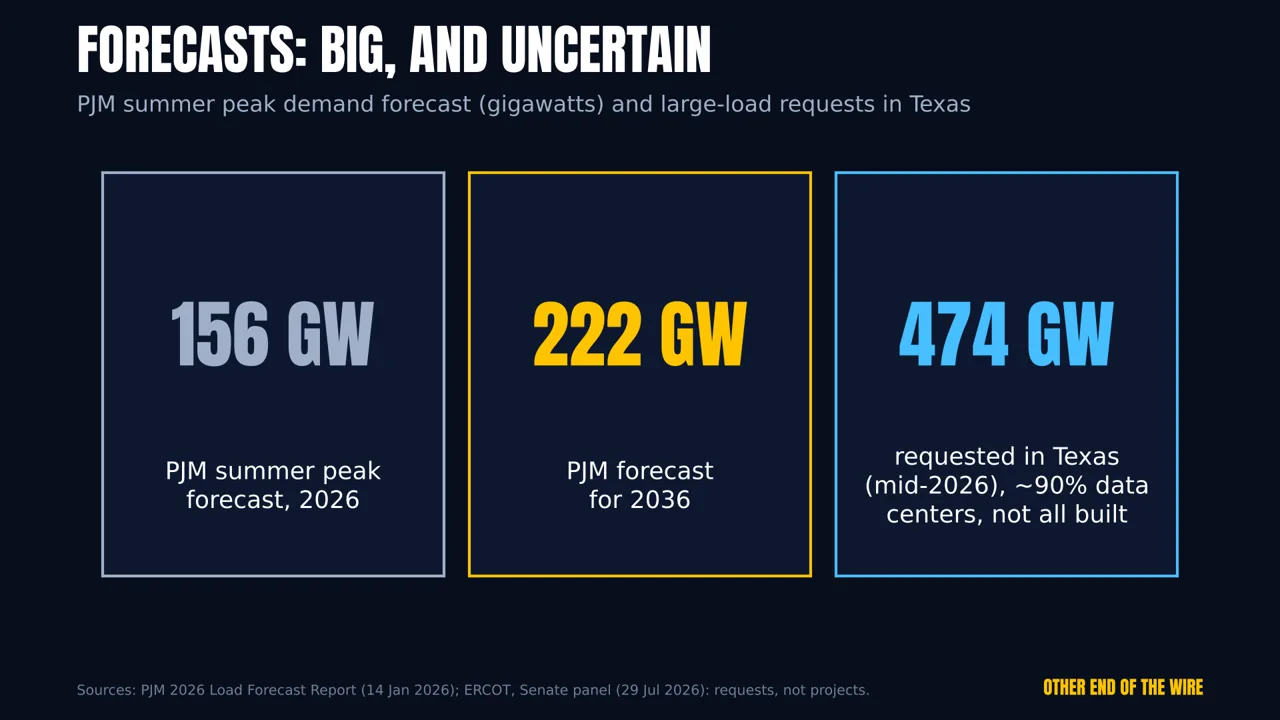
Source: PJM 2026 Load Forecast Report (14 Jan 2026); ERCOT Senate panel (29 Jul 2026): requests, not projects.PNG (1920×1080)CSV: load_forecasts.csv
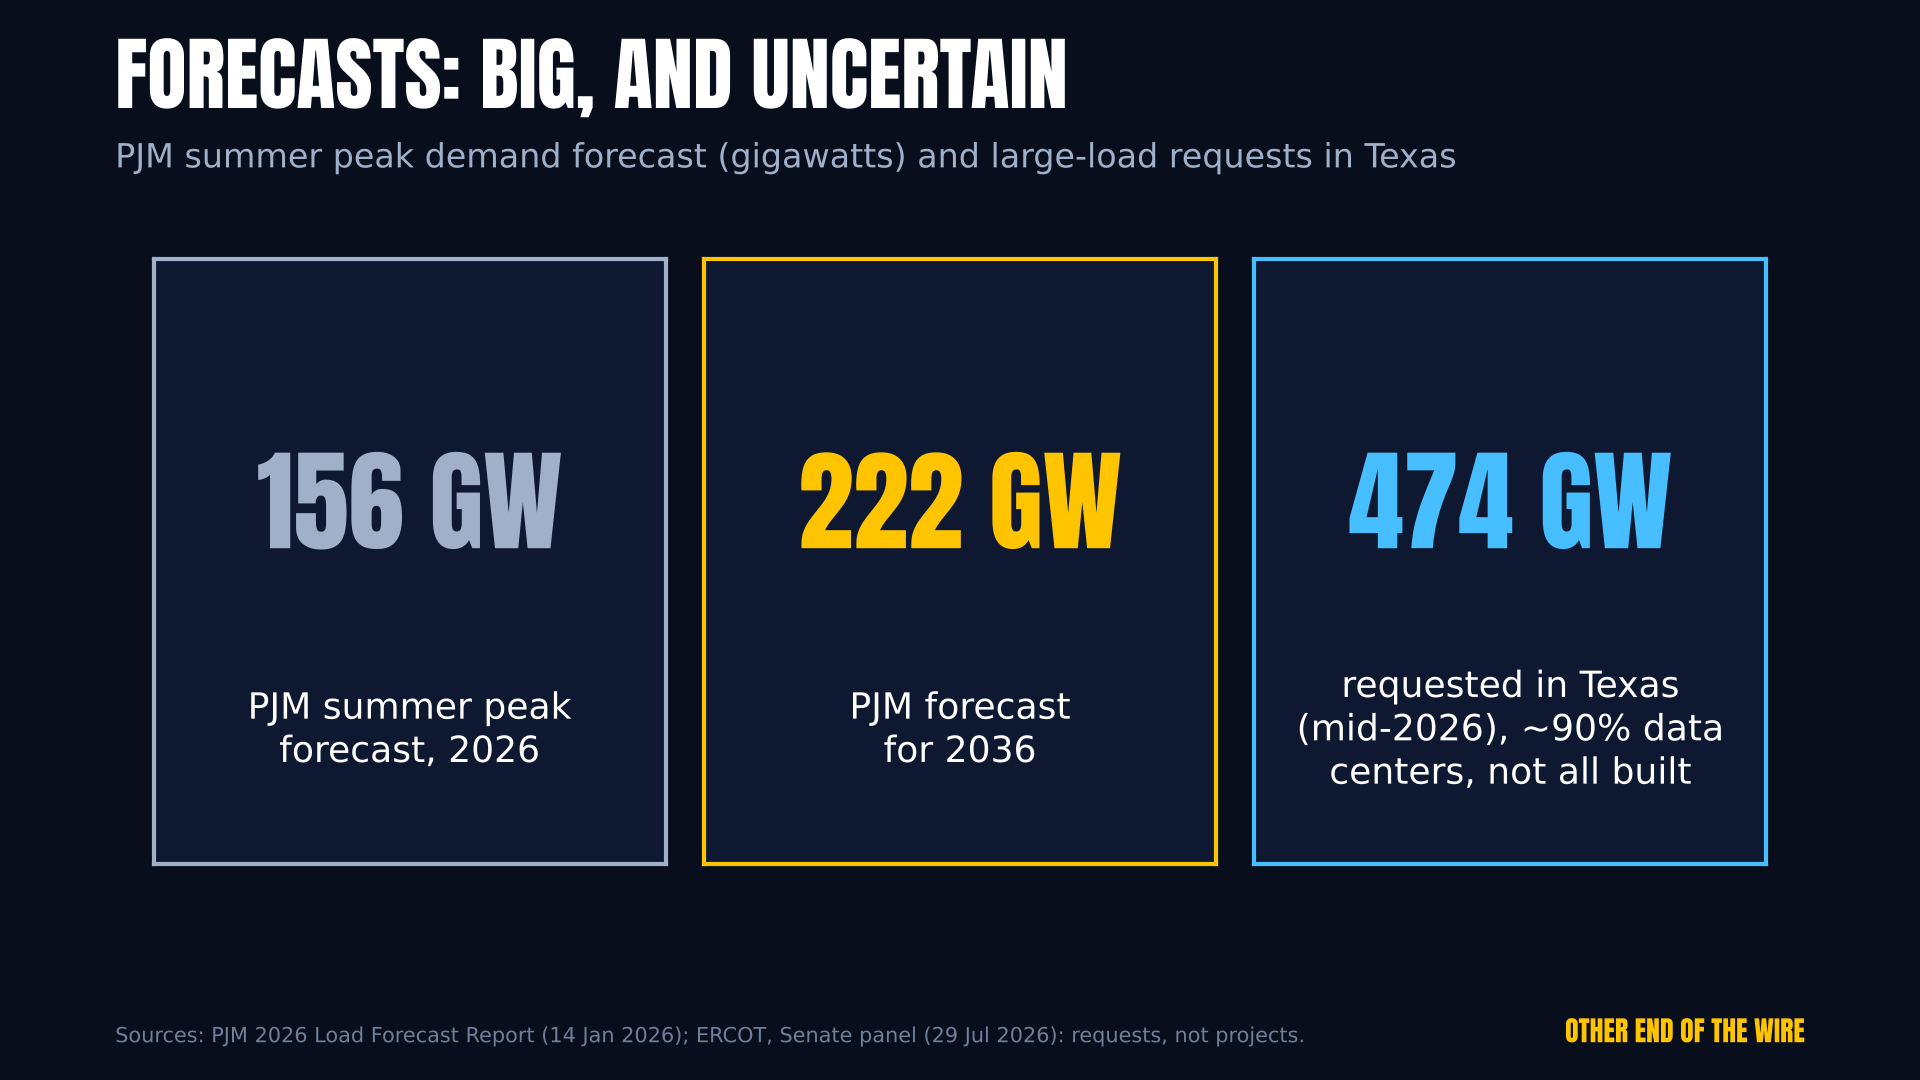
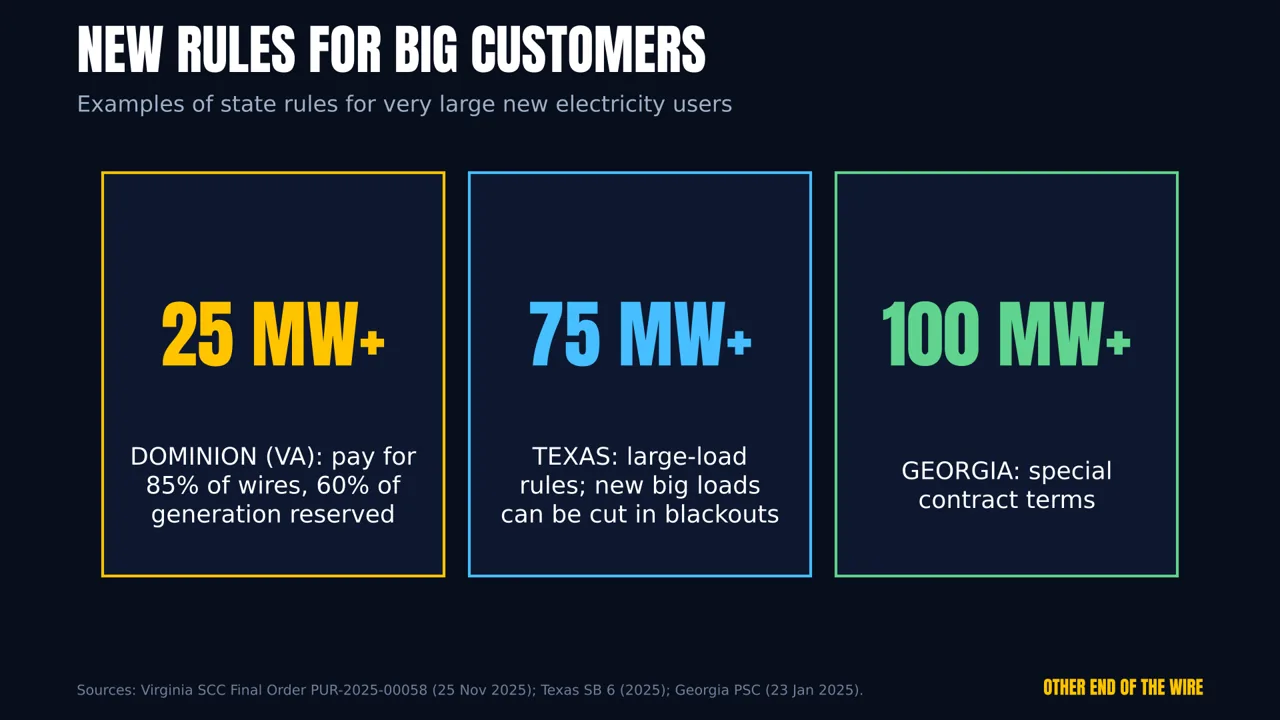
Source: Virginia SCC Final Order PUR-2025-00058 (25 Nov 2025); Texas SB 6 (2025); Georgia PSC (23 Jan 2025).PNG (1920×1080)
All data files
- household_bill_effects.csv
- load_forecasts.csv
- pjm_capacity_auctions.csv
- state_prices_2019_2026.csv
- us_datacenter_electricity.csv
- us_residential_price.csv
Sources
Every number in the video traces back to the documents below. Primary sources first; we never take numbers from news articles.
- Berkeley Lab, U.S. Data Center Energy Usage Report: 2025 Updatehttps://www.energy.gov/documents/united-states-data-center-energy-usage-report-2025-update
- EIA: Data center server energy use (2026)https://www.eia.gov/todayinenergy/detail.php?id=67704
- EIA: Dominion zone peak demand (2026)https://www.eia.gov/todayinenergy/detail.php?id=67664
- EIA Electric Power Monthly, Tables 5.3, 5.4.B, 5.6.B (our state analysis)https://www.eia.gov/electricity/monthly/
- Berkeley Lab/Brattle, Retail Electricity Price Trends 2026https://eta-publications.lbl.gov/sites/default/files/2026-07/retail_price_trends_2026_edition_julyupdate.pdf
- Wiser et al., The Electricity Journal (2025)https://doi.org/10.1016/j.tej.2025.107516
- PJM 2025/26 Base Residual Auction Reporthttps://www.pjm.com/-/media/DotCom/markets-ops/rpm/rpm-auction-info/2025-2026/2025-2026-base-residual-auction-report.pdf
- PJM 2028/29 Base Residual Auction Reporthttps://www.pjm.com/-/media/DotCom/markets-ops/rpm/rpm-auction-info/2028-2029/2028-2029-bra-results-report.pdf
- Monitoring Analytics (PJM market monitor), 2028/29 BRA analysishttps://www.monitoringanalytics.com/reports/Reports/2026/IMM_Analysis_of_the_20282029_RPM_Base_Residual_Auction_Part_A_20261030.pdf
- Monitoring Analytics, 2026 Q2 State of the Markethttps://www.monitoringanalytics.com/reports/PJM_State_of_the_Market/2026/2026q2-som-pjm-sec1.pdf
- NJ Board of Public Utilities (Feb 12, 2025)https://www.nj.gov/bpu/newsroom/2025/approved/20250212.html
- Pennsylvania PUC (Jun 2, 2025)https://www.puc.pa.gov/press-release/2025/as-electric-prices-are-rising-puc-offers-tips-to-help-you-take-control-of-your-summer-bill-06022025
- Maryland Office of People's Counsel (Jul 24, 2025)https://content.govdelivery.com/accounts/MDOPC/bulletins/3ead2f8
- PJM 2026 Load Forecast Reporthttps://www.pjm.com/-/media/DotCom/library/reports-notices/load-forecast/2026-load-report.pdf
- ERCOT, Senate panel (Jul 29, 2026)https://www.ercot.com/files/docs/2026/07/29/ERCOT-Senate-July-29-Panel-1-Assessing-The-Grid.pdf
- Virginia SCC Final Order PUR-2025-00058 (Nov 25, 2025)https://www.scc.virginia.gov/docketsearch
- Texas SB 6 (2025)https://capitol.texas.gov/tlodocs/89R/billtext/html/SB00006F.htm
- Georgia PSC (Jan 23, 2025)https://psc.ga.gov/site/assets/files/8617/media_advisory_data_centers_rule_1-23-2025.pdf
- JLARC, Data Centers in Virginia (2024)https://jlarc.virginia.gov/pdfs/reports/Rpt598.pdf
- EIA, Electric Power Monthly, Table 5.3: Average price of electricity to ultimate customers (Oct 2026 release, xlsx)https://www.eia.gov/electricity/monthly/xls/table_5_03.xlsx
- Monitoring Analytics (PJM market monitor), Market Monitor Report to the PJM Members Committee (Jul 27, 2026)https://www.pjm.com/-/media/DotCom/committees-groups/committees/mc/2026/20260727-web/item-02---marketing-monitoring-report---presentation.pdf
- EIA, Electric Power Monthly, Table 5.6.B: Average price by state, year-to-date (Oct 2026 release, xlsx)https://www.eia.gov/electricity/monthly/xls/table_5_06_b.xlsx
- Monitoring Analytics, 2025 State of the Market Report for PJM, Section 5: Capacity Market (cross-check)https://www.monitoringanalytics.com/reports/PJM_State_of_the_Market/2025/2025-som-pjm-sec5.pdf
- EIA, Electric Sales, Revenue, and Average Price 2024, Table 5A: average monthly residential consumption (xlsx)https://www.eia.gov/electricity/sales_revenue_price/xls/table_5A.xlsx
Claim-by-claim evidence (0 rows)
Research sheet, checked on 2026-11-11 (three review rounds; own calculation re-run; primary texts opened).
| Claim | Value | Source |
|---|
Notes
- Our $7–12/month figure is a rough estimate: the market monitor’s +$11.11/MWh (first half of 2026) × EIA average household use. It is an illustration, not a line on any specific bill.
- The state comparison shows a correlation (r = −0.44), not causation.
Narration is AI-generated; script researched and reviewed by a human.
Education only, not financial advice.
The creator has no financial interest in any U.S. utility or data-center company.
Spotted an error? Tell us – fixes are logged on the corrections page.